The origin of the population data is described in [36].
This data has a resolution of ![]() (about 54.7km
(about 54.7km![]() ) i. e. the earth is divided into a number of spherical
rectangles of size as above and the number of inhabitants in some of them is
given, and represents the human population of the earth for 1994.
Note that it will be hard to use realistic population data with much better
resolution, since the actual point of living of the humans is not of great
interest to us. In western Europe, north America and similar regions of the
earth, the location of living of a human can differ significantly from the
location where the individual spends a large amount of his time. It has
been estimated that the average daily activity radius for a human being living
in western Europe is ca. 15km [36]. Although the actual radius
is cultural, environmental, social, and urban/rural dependent, we see no reason
to use a higher spatial resolution of the population distribution pattern.
No attempt has been made to extrapolate the data given to the time
period in which the simulation takes place (see Section 6.1.3).
While this might be an important issue in developing countries to account
for migrational patterns, birth and death rates, and outdated data, it was
felt that this does not compromise data accuracy here.
) i. e. the earth is divided into a number of spherical
rectangles of size as above and the number of inhabitants in some of them is
given, and represents the human population of the earth for 1994.
Note that it will be hard to use realistic population data with much better
resolution, since the actual point of living of the humans is not of great
interest to us. In western Europe, north America and similar regions of the
earth, the location of living of a human can differ significantly from the
location where the individual spends a large amount of his time. It has
been estimated that the average daily activity radius for a human being living
in western Europe is ca. 15km [36]. Although the actual radius
is cultural, environmental, social, and urban/rural dependent, we see no reason
to use a higher spatial resolution of the population distribution pattern.
No attempt has been made to extrapolate the data given to the time
period in which the simulation takes place (see Section 6.1.3).
While this might be an important issue in developing countries to account
for migrational patterns, birth and death rates, and outdated data, it was
felt that this does not compromise data accuracy here.
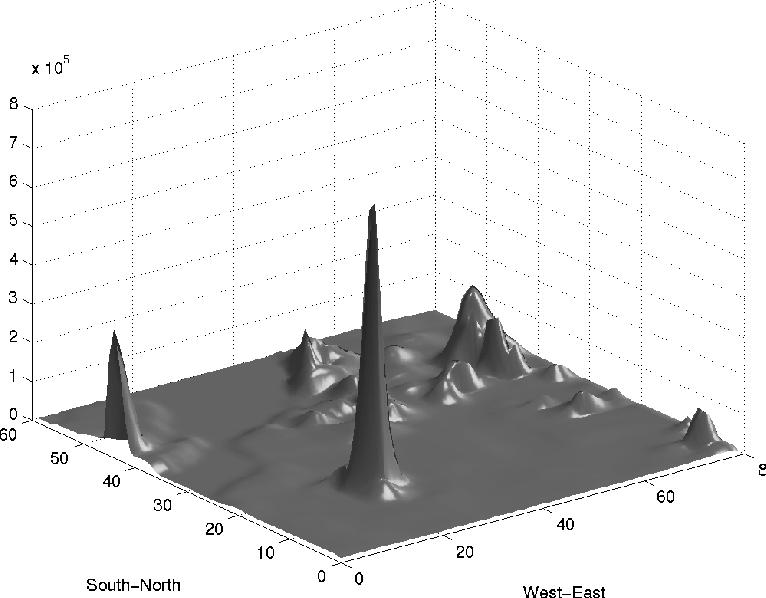
Since the population data used by OLAF is discretized on the
meteorological grid, the original data has been bilinearly interpolated to
generate the corresponding values. Figure 6.3
and 6.4 (p. ![]() ,
, ![]() )
show the resulting discrete distribution function interpolated by bicubic
splines.
)
show the resulting discrete distribution function interpolated by bicubic
splines.
In total, roughly 58 million people live in the region which the case study considers.

Figure 6.3: Population distribution on the computational grid
as seen from the southwest.
The highest peak represents Paris, the "hills" near the far away corner are
the cities in the Rhine-Ruhr area. On the left side, greater London area
is just cut off.

Figure 6.4: Population distribution on the computational grid
as seen from the north east. Compare also Figure 6.3.
The small peak just in front of Paris is Brussels.